Using Falco to monitor outbound traffic for Pods in Kubernetes
Overview
Using Falco to monitor outbound traffic for Pods in Kubernetes
Falco is an opensource project from Sysdig focused on container runtime and cloud native security, that uses modern technologies like eBPF to monitor environment situations using syscalls and other events sources
We’ve used Falco some time ago as a PoC to monitor some specific events, and recently I’ve started to mess with it a bit to help contributing on it as a request from the amazing Dan Pop and also to understand better how Falco could help me in future situations.
The problem I needed to solve
Who uses Kubernetes knows how hard is to keep track of networking connections originated from Pods. Even using Network Policies, it’s hard to assess which Pod tried to open a connection to internal or external world.
Having this kind of information is essential in environments with a higher restriction level, or even if you need to legally answer “who was connecting to this network endpoint”.
Some CNI providers have specific solutions, like Antrea exporting via Netflow, or Cilium with a short retention solution and visualization with project Hubble.
But I wanted something more: I wanted a solution that could be applied with any CNI, even if it does not support Network Policy. I don’t care if the connection was dropped or not, I wanted to know how to monitor every connection attempt my Pods does. And this can be monitored, as every connection generates a syscall.
The final result
Let me introduce you Falco!
As I’ve explained before, Falco is an opensource project that monitors events in servers. Those events can be syscalls from containers, or even Kubernetes audit events.
Falco is based in rules. Those rules mainly define:
- a common name (
rule) - “Unauthorized SSH access” - a description (
desc) - “Some user attempted to login in an SSH service” - a priority (
priority) - “WARNING” - a detailed output from the event (
output) - “Server ‘homer’ received a connectin in port 22 from the non authorized IP 192.168.0.123” - a condition (
cond) - “(Server has the word ‘restricted’ in the hostname, and receives a connection in port 22 from a source that is not network 10.10.10.0/24) OR (server received a connection in port 22 mas the process that received this connection is not called ‘sshd’)
Here, I need to point something: I wrote the condition field above in a really simple form, as a common language. Besides Falco rules not being written exactly in this form (as we will see below), it’s a really similar format, making it easier to read the rules.
The rules can also contain other fields not explained here, like exceptions, aditional tags, and also lists and macros that turns repetition of strings easier.
Installing Falco
Before we begin to install Falco, a brief description of my environment:
- 3 virtual servers with Flatcar Linux 2765.2.2, because I LOVE FLATCAR MODEL!! (and also it has an up to date Kernel, which allows me to use Falco eBPF driver). If you want to learn how to install Flatcar in 5 minutes using VMware Player, there’s a blog post here explaining how.
- My physical networking is
192.168.0.0/24 - My Kubernetes install is v1.21.0 via Kubeadm. Pods are creted in network
172.16.0.0/16
To install Falco on Kubernetes using helm, basically you need to follow 4 steps:
1kubectl create ns falco
2helm repo add falcosecurity https://falcosecurity.github.io/charts
3helm repo update
4helm install falco falcosecurity/falco --namespace falco --set falcosidekick.enabled=true --set falcosidekick.webui.enabled=true --set ebpf.enabled=true
After that, you just need to verify if all Pods in namespace falco are running, with kubectl get pods -n falco
With this install, I’ve also enabled sidekick which is a really cool project that exports Falco events to a bunch of outputs, and also allows you to visualize them in its own interface
Creating and visualizing alerts
Falco has some default rules. As an example, as soon as it is executing, if you issue a kubectl exec -it to a Pod, it will generate some alert:
1kubectl exec -it -n testkatz nginx-6799fc88d8-996gz -- /bin/bash
2root@nginx-6799fc88d8-996gz:/#
And in Falco logs (I’ve made this JSON clearer, but it’s a one liner)
 1{
 2    "output":"14:23:15.139384666: Notice A shell was spawned in a container with an attached terminal (user=root user_loginuid=-1 k8s.ns=testkatz k8s.pod=nginx-6799fc88d8-996gz container=3db00b476ee2 shell=bash parent=runc cmdline=bash terminal=34816 container_id=3db00b476ee2 image=nginx) k8s.ns=testkatz k8s.pod=nginx-6799fc88d8-996gz container=3db00b476ee2",
 3    "priority":"Notice",
 4    "rule":"Terminal shell in container",
 5    "time":"2021-04-16T14:23:15.139384666Z",
 6    "output_fields": {
 7        "container.id":"3db00b476ee2",
 8        "container.image.repository":"nginx",
 9        "evt.time":1618582995139384666,
10        "k8s.ns.name":"testkatz",
11        "k8s.pod.name":"nginx-6799fc88d8-996gz",
12        "proc.cmdline":"bash",
13        "proc.name":"bash",
14        "proc.pname":"runc",
15        "proc.tty":34816,
16        "user.loginuid":-1,
17        "user.name":"root"
18    }
19}
In this log you can check that besides the output message, some additional fields are mapped, like the process name, the namespace and the pod name. We will explore this further.
Creating rules for Falco
Falco can monitor syscalls. A syscall of a network connection is of the ‘connect’ type, and this way, we can create a basic rule so Falco can always generate a notification when some container tries to connect to the outside world.
Falco already comes with a pre defined list and macro for outbound connections:
 1# RFC1918 addresses were assigned for private network usage
 2- list: rfc_1918_addresses
 3  items: ['"10.0.0.0/8"', '"172.16.0.0/12"', '"192.168.0.0/16"']
 4
 5- macro: outbound
 6  condition: >
 7    (((evt.type = connect and evt.dir=<) or
 8      (evt.type in (sendto,sendmsg) and evt.dir=< and
 9       fd.l4proto != tcp and fd.connected=false and fd.name_changed=true)) and
10     (fd.typechar = 4 or fd.typechar = 6) and
11     (fd.ip != "0.0.0.0" and fd.net != "127.0.0.0/8" and not fd.snet in (rfc_1918_addresses)) and
12     (evt.rawres >= 0 or evt.res = EINPROGRESS))
This macro:
- Verifies if the event is of type connect (network connection) and it’s outbound (
evt.dir=<) - OR if this is a sendto or sendmsg type going outbound, which protocol is not TCP and the file descriptor is not connected, and the name does not change, tipically an UDP connection.
- If any of the conditions above are true AND the file descriptor is 4 or 6, which represents IPv4 or IPv6
- AND the IP is not equal to 0.0.0.0 AND the network is not equal to 127.0.0.0/8 (localhost) AND the destination network (
fd.snet) is not in listrfc_1918_addresses - AND the return from the event is bigger than 0 OR is INPROGRESS
If you put this expression in vscode, you can work through the openning and closure of parenthisis. All existing fields are really well explained in supported fields
But the above macro does not fits our needs, as it ignores the outbound connections to internal networks (rfc1918), which is the majority of enterprise cases. Let’s define then our own macro and rule:
 1- macro: outbound_corp
 2  condition: >
 3    (((evt.type = connect and evt.dir=<) or
 4      (evt.type in (sendto,sendmsg) and evt.dir=< and
 5       fd.l4proto != tcp and fd.connected=false and fd.name_changed=true)) and
 6     (fd.typechar = 4 or fd.typechar = 6) and
 7     (fd.ip != "0.0.0.0" and fd.net != "127.0.0.0/8") and
 8     (evt.rawres >= 0 or evt.res = EINPROGRESS))
 9
10- list: k8s_not_monitored
11  items: ['"green"', '"blue"']
12
13- rule: kubernetes outbound connection
14  desc: A pod in namespace attempted to connect to the outer world
15  condition: outbound_corp and k8s.ns.name != "" and not k8s.ns.label.network in (k8s_not_monitored)
16  output: "Outbound network traffic connection from a Pod: (pod=%k8s.pod.name namespace=%k8s.ns.name srcip=%fd.cip dstip=%fd.sip dstport=%fd.sport proto=%fd.l4proto procname=%proc.name)"
17  priority: WARNING
The rule above:
- Creates a macro
outbound_corpthat deals with any outbound connection - Creates a list
k8s_not_monitoredwith valuesblueandgreen - Creates a rule that verifies:
- If it’s an outbound traffic defined in macro
outbound_corp - AND If the field k8s.ns.name is defined (which means it’s being executed inside Kubernetes)
- And if the namespace containing the Pod does not have a label
networkcontaining any of the values in listk8s_not_monitored. If it does, the traffic wont be monitored
- If it’s an outbound traffic defined in macro
When this rule is triggered, the following output might be seen:
1Outbound network traffic connection from a Pod: (pod=nginx namespace=testkatz srcip=172.16.204.12 dstip=192.168.0.1 dstport=80 proto=tcp procname=curl)
Applying the rules
Helm chart allows us to install custom rules without much effort.
To do so, we need to pick the rules above and put inside a customRules structure, before ‘upgrading’ the installation:
 1customRules:
 2  rules-networking.yaml: |-
 3    - macro: outbound_corp
 4      condition: >
 5        (((evt.type = connect and evt.dir=<) or
 6          (evt.type in (sendto,sendmsg) and evt.dir=< and
 7           fd.l4proto != tcp and fd.connected=false and fd.name_changed=true)) and
 8         (fd.typechar = 4 or fd.typechar = 6) and
 9         (fd.ip != "0.0.0.0" and fd.net != "127.0.0.0/8") and
10         (evt.rawres >= 0 or evt.res = EINPROGRESS))
11    - list: k8s_not_monitored
12      items: ['"green"', '"blue"']
13    - rule: kubernetes outbound connection
14      desc: A pod in namespace attempted to connect to the outer world
15      condition: outbound_corp and k8s.ns.name != "" and not k8s.ns.label.network in (k8s_not_monitored)
16      output: "Outbound network traffic connection from a Pod: (pod=%k8s.pod.name namespace=%k8s.ns.name srcip=%fd.cip dstip=%fd.sip dstport=%fd.sport proto=%fd.l4proto procname=%proc.name)"
17      priority: WARNING
It’s the same rule as above, but inside a customRules.rules-networking.yaml field.
After that we just need to update Falco installation, with the following:
1helm upgrade falco falcosecurity/falco --namespace falco --set falcosidekick.enabled=true --set falcosidekick.webui.enabled=true --set ebpf.enabled=true -f custom-rules.yaml
Falco Pods will be restarted. If the Pod enters in an Error state, take a look into their logs to see if there’s some failure on rules (yaml = space problems!)
Show me the logs!!!
Executing kubectl logs -n falco -l app=falco we will see our outbound connection logs appearing:
 1{
 2    "output":"18:05:13.045457220: Warning Outbound network traffic connection from a Pod: (pod=falco-l8xmm namespace=falco srcip=192.168.0.150 dstip=192.168.0.11 dstport=2801 proto=tcp procname=falco) k8s.ns=falco k8s.pod=falco-l8xmm container=cb86ca8afdaa",
 3    "priority":"Warning",
 4    "rule":"kubernetes outbound connection",
 5    "time":"2021-04-16T18:05:13.045457220Z",
 6    "output_fields":
 7    {
 8        "container.id":"cb86ca8afdaa",
 9        "evt.time":1618596313045457220,
10        "fd.cip":"192.168.0.150",
11        "fd.l4proto":"tcp",
12        "fd.sip":"192.168.0.11",
13        "fd.sport":2801,
14        "k8s.ns.name":"falco",
15        "k8s.pod.name":"falco-l8xmm"
16    }
17}
But those are logs generated by the own Falco containers, and we don’t want them. Let’s mark this namespace with the label that will make it stop generating the logs from those Pods traffic:
1kubectl label ns falco network=green
Nice! Now that Falco Pods does not enter anymore in monitoring, let’s make some tests :D For that, I’ve created a namespace called testkatz with some Pods inside, and then I’ve started to generate some outbound traffic:
1"output":"18:11:04.365837060: Warning Outbound network traffic connection from a Pod: (pod=nginx-6799fc88d8-996gz namespace=testkatz srcip=172.16.166.174 dstip=10.96.0.10 dstport=53 proto=udp procname=curl)
2=====
3"output":"18:11:04.406290360: Warning Outbound network traffic connection from a Pod: (pod=nginx-6799fc88d8-996gz namespace=testkatz srcip=172.16.166.174 dstip=172.217.30.164 dstport=80 proto=tcp procname=curl)
In the above log, we can see a call to the DNS, followed by a call to the destination server. We can see also which program inside the container started this traffic.
A better visualization
No one deserves to monitor by watching JSON logs streaming on the screen, right? Here comes Falco Sidekick to the rescue. It was installed with Falco, so we only need to configure it to send those “alerts” to a desired output.
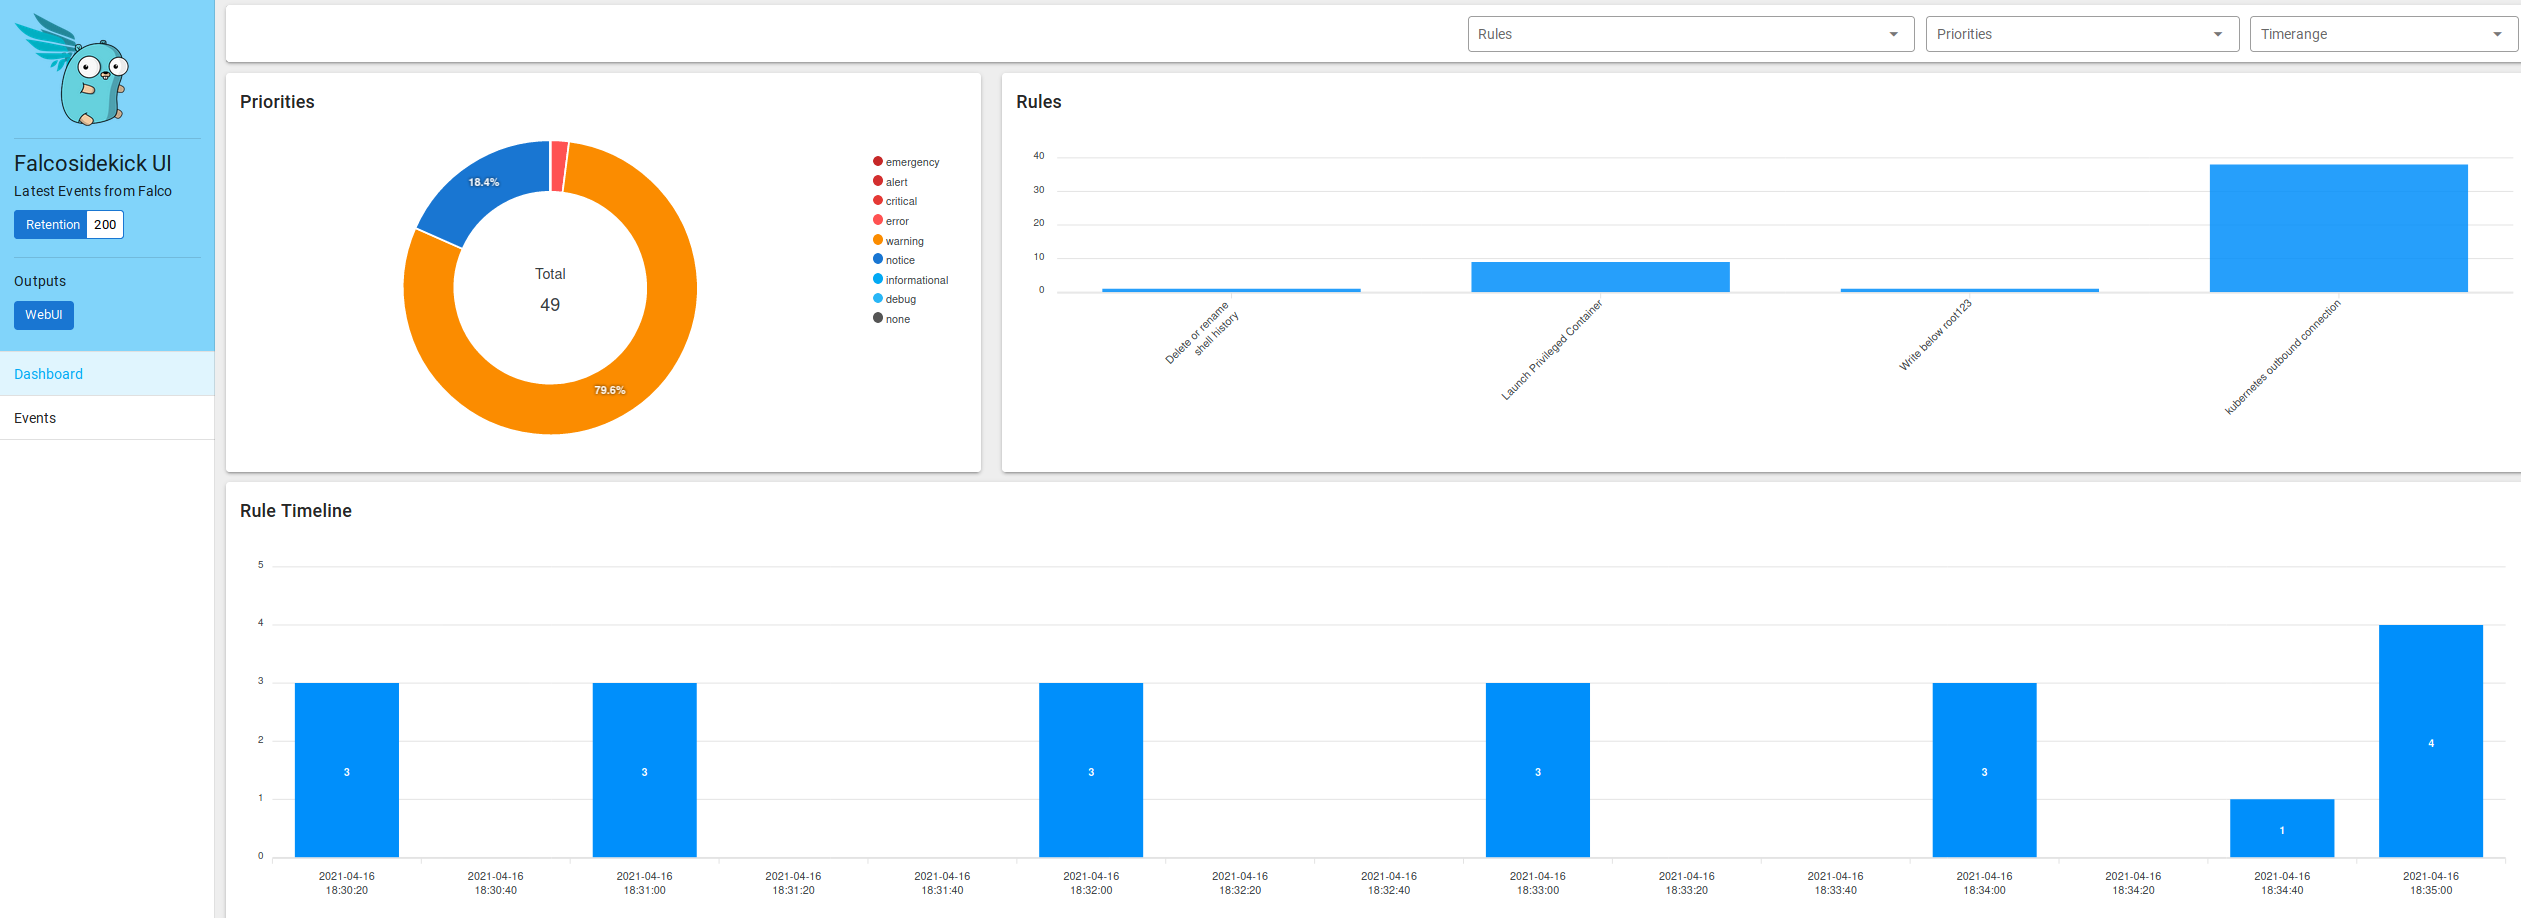
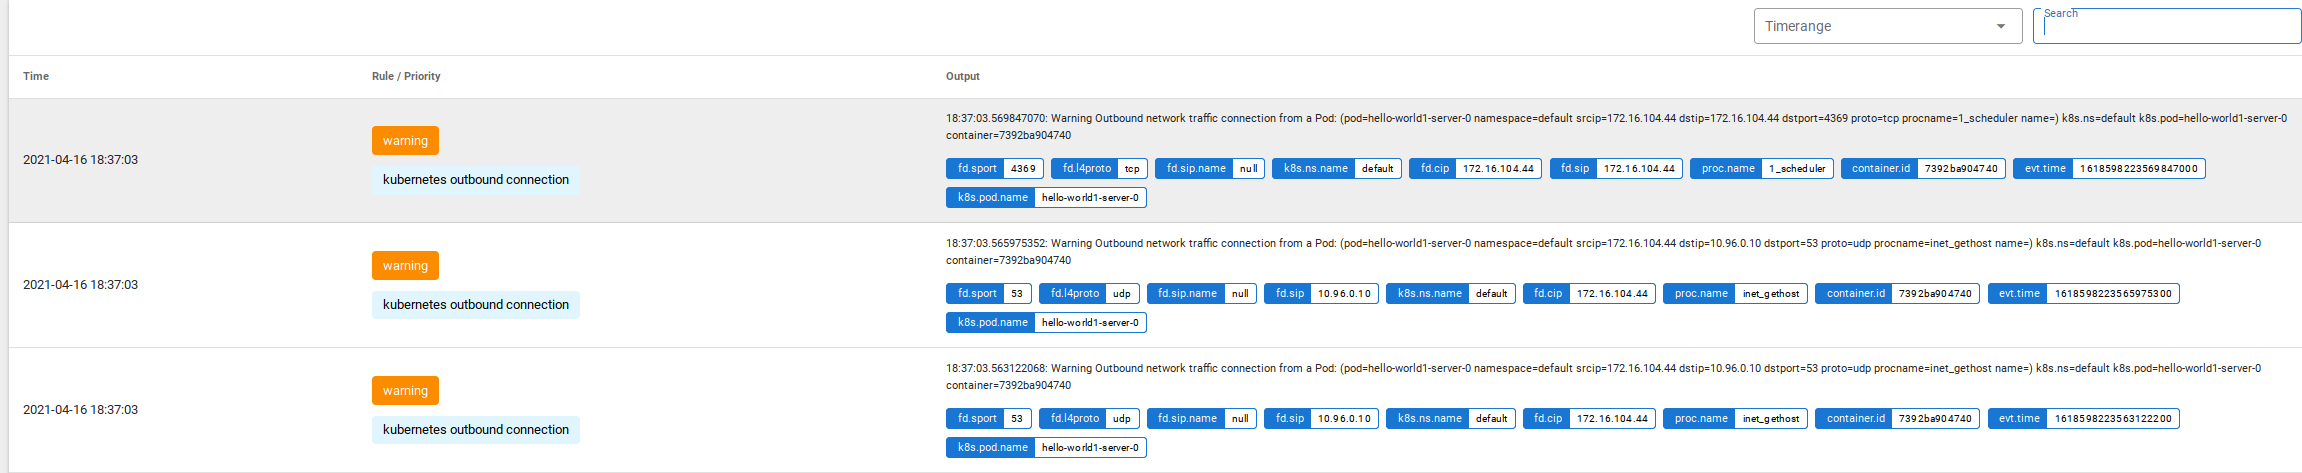
Sidekick comes with a web interface, that can be accesses with a port-forward, as example:
1kubectl port-forward -n falco pod/falco-falcosidekick-ui-764f5f469f-njppj 2802
After that, you only need to access with your browser [http://localhost:2802/ui] and you will have something as cool as:
But I want to send this to a place where I can retain this, as some install of Grafana Loki. You can use the Grafana Cloud Freetier for this example, but do not use this in production if you have a lot of logs :)
After generating a user and apikey in Grafana Cloud, you can update your Falco sidekick install with the following command (thanks Thomas Labarussias for the idea!):
1helm upgrade falco falcosecurity/falco --namespace falco --set falcosidekick.enabled=true --set falcosidekick.webui.enabled=true --set ebpf.enabled=true --set falcosidekick.config.loki.hostport=https://USER:APIKEY@logs-prod-us-central1.grafana.net -f custom-rules.yaml
Restart sidekick with kubectl delete pods -n falco -l app.kubernetes.io/name=falcosidekick and you should see messages like [INFO] : Loki - Post OK (204) in sidekick log each time a new alert is triggered.
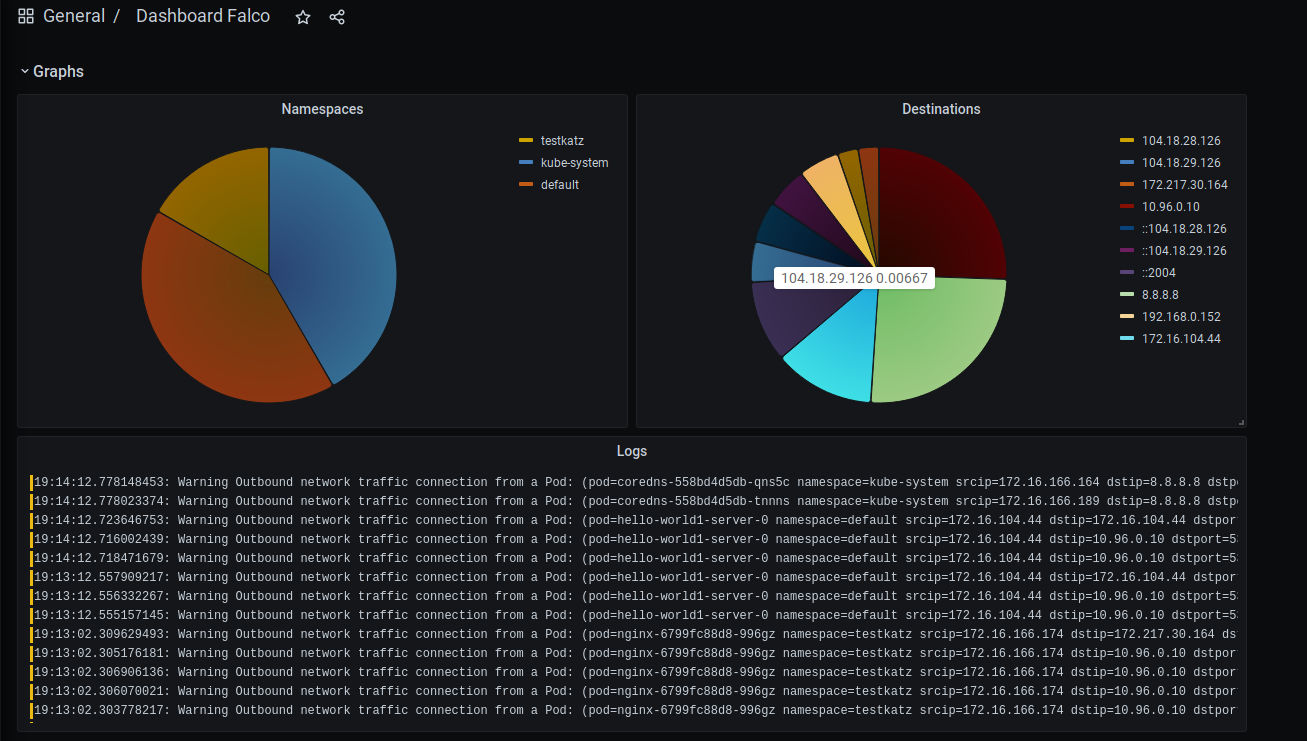
With that, you may have a dashboard in Grafana Cloud as I shown you on the beginning of this article :)
Here is my dashboard example, but remember to change your Loki datastore, and also if you have improved this dashboard please post its config and a picture to make me happy!